Two steps up and one step down
- Rogier G. van de Grift

- Oct 2, 2020
- 4 min read
Update end of Q3 2020; two steps up and 1 step down
Beat the S&P 500 index using momentum
Holland Park Capital London Ltd has developed a proprietary quant screen that uses momentum to invest in stocks. On the 1st of July 2020 (the start of Q3) the strategy started with a begin value of $50000. The Trading Portfolio; Momentum strategy went live trying to beat the S&P 500 index with the momentum signal. Rebalancing was set as quarterly. It is the end of Q3 now so it is time for an update before the portfolio is rebalanced. Below are some pictures from the momentum portfolio as of the second of July 2020;


The Trading Portfolio; Momentum had 226 small positions in S&P 500 stocks in Q3 2020. At the end of Q3 the momentum portfolio looked like below pictures from the broker;

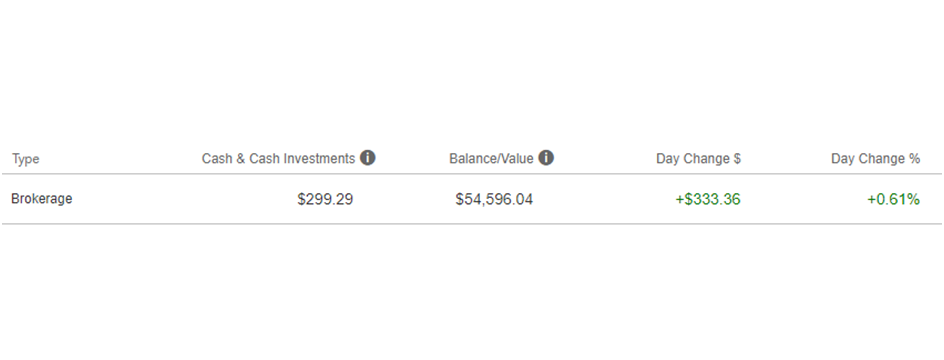

Q3 was a good time for the momentum portfolio. It can best be described as 2 steps up and 1 step down. July and August were good for the momentum portfolio, but in September the S&P 500 fell 3.9%. September was the first monthly loss for the S&P 500 index since March 2020. Ignoring the cash income from dividends the momentum portfolio grew from $50000 into $54296 in Q3. The dividend income was harvested and was taken out of the account as per below broker screenshot on the 2nd of October 2020.

As an investible benchmark the Vanguard S&P 500 ETF (VOO) had been chosen. VOO can be expected to have a tiny underperformance versus the S&P 500 index, but at least is a real investable option for private investors. $50000 was invested on paper on the close of June 30 in the VOO. That paper trade has been put in two portfolio tracking websites. As of the second of July 2020 on the Stockrover website the VOO paper portfolio looked like below;


At the close of the 2nd of July 2020 the VOO paper portfolio on Stockrover had a value of $50596 so above the Trading Portfolio; Momentum of $50441. The VOO paper portfolio was also tracked on the Sigfig website. At the close of the second July 2020 the Sigfig looked like below.


As you can see the 2nd of July value for the VOO paper portfolio on Sigfig was even slightly higher at $50765. So the comparison is fair at the end of Q3 between the paper and real money portfolios as the VOO paper portfolio was ahead for on the 2nd of July 2020.
As of the first of October 2020 before the US markets opened on the Stockrover website the VOO paper portfolio looked like below;


As of the first of October 2020 before the US markets opened the Sigfig VOO ETF portfolio looked like below;

So how was the relative performance of the momentum portfolio since the last update?

So the relative performance in Q3 2020 was a nothing done. The Trading Portfolio Momentum has managed to catch up with the VOO Stockrover paper portfolio, but is still below the VOO Sigfig paper portfolio. Hopefully the Trading Portfolio Momentum will be able to leave the 2 paper portfolios in the dust at the end of Q4 thanks to the next rebalance.
The S&P 500 index by the way is getting more and more concentrated. In terms of concentration it is now starting to compare to how the Nasdaq 100 looked about 10 years ago. The top 10 holdings of the S&P 500 index make up 27.94% of the index as of the 1st of October according to Slickcharts.com.
Here are the top S&P 500 index holdings courtesy of Slickcharts;

The momentum portfolio in Q3 looked completely different. Here are the top 10 holdings in Q3 before the Q4 rebalance from the broker;

Amazon and Nvidia were the only top holdings that overlapped. The momentum portfolio had 16.87% of the value of the portfolio in the top 10 holdings. So the momentum portfolio is less concentrated and more diversified, but probably also underweight the so called FAANG names. The high concentration in the big tech names has served the Nasdaq 100 index well and thanks to the continued popularity of indexing and ETF’s it may do the same thing for the S&P 500 index in the next couple of years. As an aside the top 10 holdings of the Nasdaq 100 index now make up a cool 56% of the value of the Nasdaq 100 index. Eat or be eaten. The big Nasdaq and S&P 500 companies are getting bigger. Survival of the fittest as an investment principle has clearly worked for the Nasdaq 100 index in the last years. See the following chart of StockCharts.com for some proof of that;

Hopefully you liked the blog. The blog is not advice on what you should do with your money and the blog was written for information purposes only. When you invest in the stock markets it is very possible to lose money. Please do your own research. If in any doubt what is best in your individual situation, please hire a licensed financial advisor. Good luck on your investment journey.


Comments